Projected Scores, Rebuilt:A Calibrated Average and a Ceiling You Choose
A new model now produces the Projected Score for every player with game history. It delivers two numbers, a calibrated average and a separate ceiling (Q80), and you decide whether SoProb shows one of them or both.
In August I changed how Projected Scores treat ceiling potential. The proven baseline stayed, and a player-specific uplift added upside whenever the upcoming matchup supported it.
Read the August article: Projected Scores Reimagined
That update was a small adjustment on top of the old model, and one limitation remained: a single number still had to do two jobs. It was meant to say what a player will probably score and, at the same time, how high that player can go.
From now on, a new model built from scratch produces the Projected Score for every player with game history. It replaces both the baseline and the uplift, and it answers the two questions separately.
What changes at a glance
| Since August | Now | |
|---|---|---|
| Projected Score | Baseline + ceiling uplift | New model, built from scratch |
| Numbers | One PS | Average (PS) and Ceiling (Q80) |
| Your choice | Same PS for everyone | Average, Ceiling or both side by side |
| DS% and xAA | Separate calculations | Same approach and inputs |
| 70+ and 80+ | Not shown | P70% and P80% columns |
| No odds yet | Fallback values | Projection from own games, marked |
Two numbers instead of one
Average (PS) is what the player scores on average in this match, as if the match could be replayed many times. It is calibrated: players projected at 60 actually score around 60 on average. Because it is an average, most values sit between 40 and 60, and extreme outcomes are smoothed out. The Average rarely goes above 70: in the tests only 0.25% of the projections did, and in the current Gameweeks it is 33 of about 14,200 values. If you are looking for 70+ candidates, use the Ceiling.
Ceiling (Q80) is the score the player reaches or beats in about one match in five. In four out of five matches the player stays below it, in one out of five above it. It shows the upside: how much room there is for a big score.
Like the previous Projected Score, both numbers assume that the player starts and plays at least 45 minutes.
Two players with the same average can have very different ceilings. Two real projections from the current Gameweeks:
| Average | Ceiling (Q80) | P70% | DS% | |
|---|---|---|---|---|
| Defender | 51.7 | 62.5 | 13.5% | 10% |
| Forward | 51.6 | 73.0 | 22.6% | 43% |
Both players are expected to score about 52. The defender's results are tightly grouped, so the ceiling is only about 11 points higher. The forward either produces a decisive action or does not, which spreads the outcomes: the ceiling is more than 21 points above the average, and the chance of a 70+ score is almost twice as high.
Across all current projections the ceiling typically sits about 14 to 19 points above the average: the smallest gap for midfielders and the largest for goalkeepers.
Choose what SoProb shows
Open Settings > Preferences and switch on Average, Ceiling (Q80) or both under Projected Score. The choice is saved to your account and applies everywhere at once. Both are on by default.

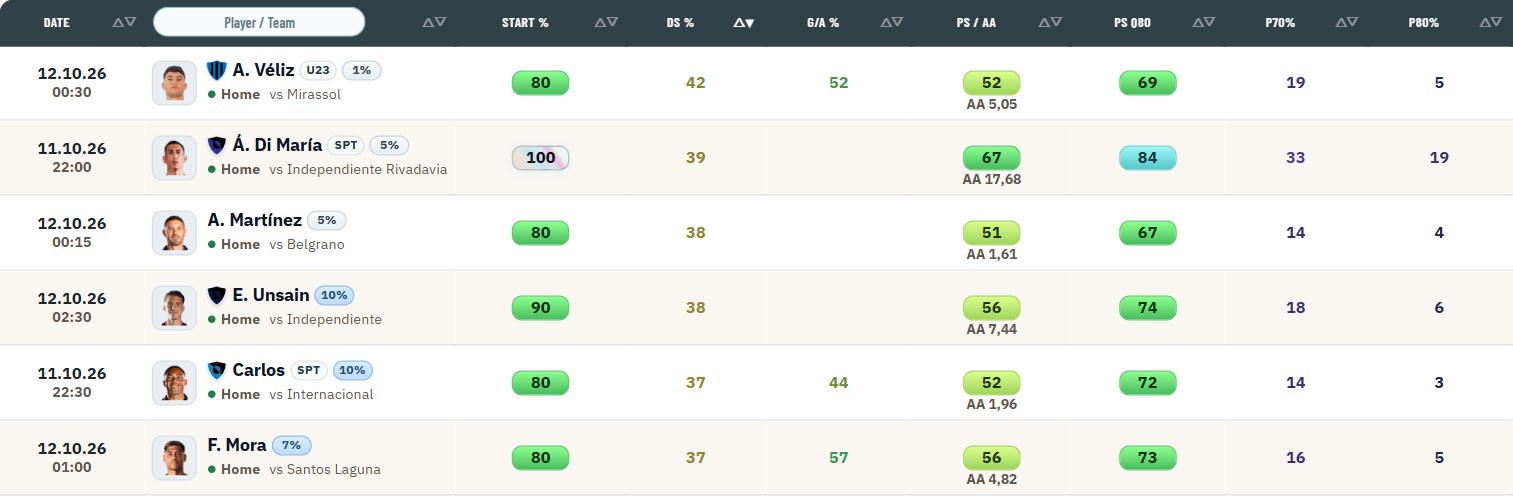
- Both on: the player tables show PS / AA and, right behind it, a PS Q80 column with its own minimum filter. The PS itself, the lineup totals and the image export stay on the average.
- Ceiling only: the PS columns show the ceiling and read PS Q80, so you always know which number you are looking at. Sorting and the minimum PS filter follow it.
- Average only: one PS, the average.
The setting covers:
- Player DB, My Players and Set Players
- Lineup Builder, including the autobuilder, the team total and the image export
- GW Center, fixture lineups, Vault and Watchlist
- Daily Missions and the DS Picker
- The browser extension from version 0.1.55: with only the ceiling switched on, the badge reads Q80 instead of PS; otherwise it shows the average
Some values always stay on the average: Dif, the value columns, DS% and xAA. Dif compares the expectation with the L10 average. Comparing a ceiling with an average would make almost every player look like a bargain.
P70% and P80%: the chance of a big score
Directly behind the PS, the player tables now show two more columns: P70% and P80%. They give the probability that the player's own Sorare score, without card, captain or lineup bonuses, reaches 70 or more, or 80 or more, in this match, under the same condition: the player starts and plays at least 45 minutes. You find them in Player DB, My Players, Set Players, the Lineup Builder, Vault, Watchlist, Daily Missions and the DS Picker.
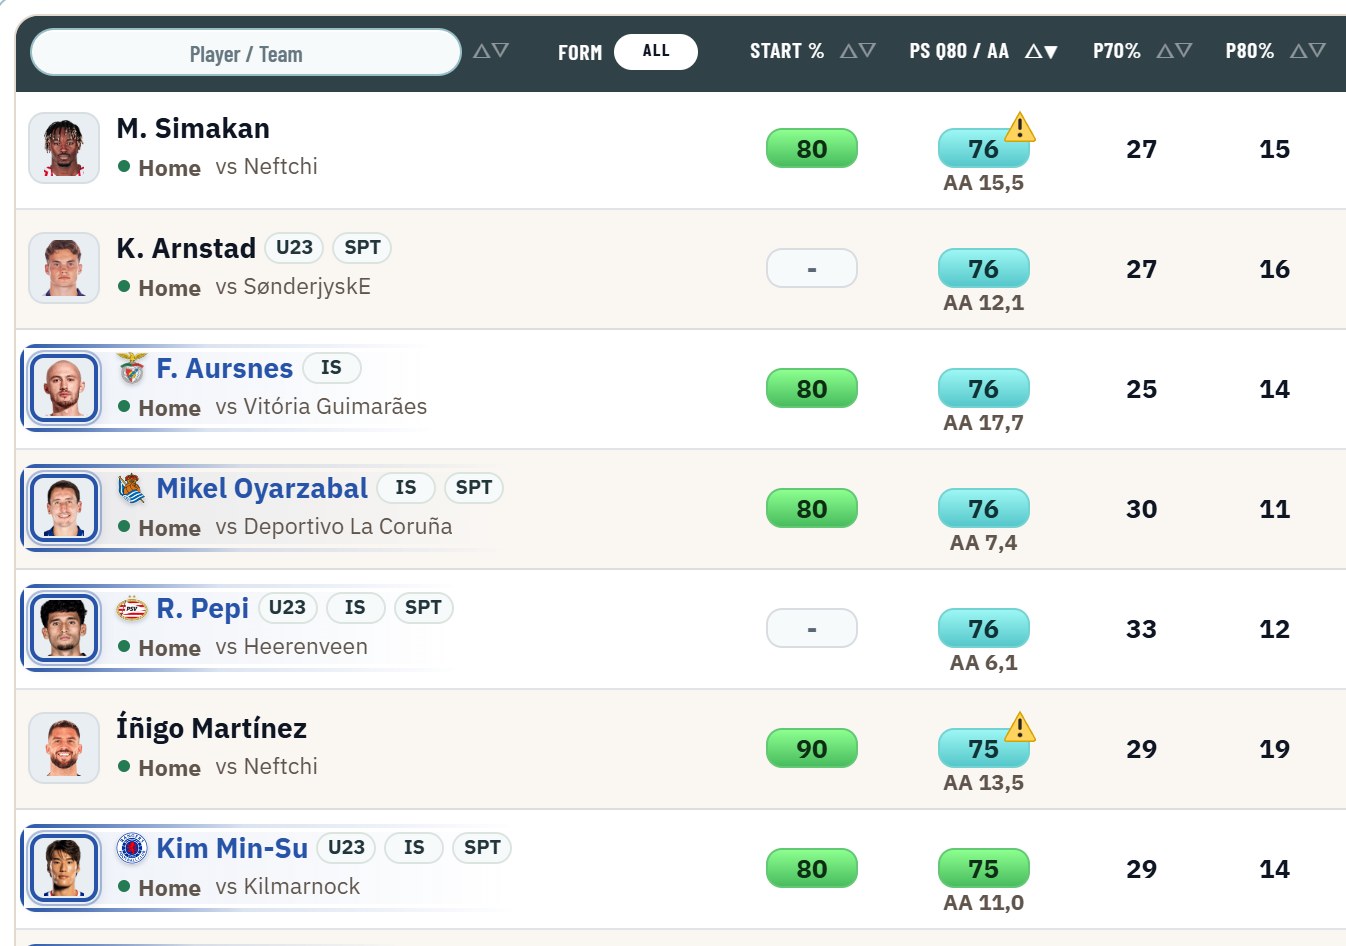
A card with a bonus needs fewer points. With a 10% bonus, 63.6 points already make 70 for the card, so its chance of a 70+ card score is higher than the P70% shown for the player.
The values are calibrated. In the historical tests, the players with the highest chances were given 30.7% and reached 70+ in 30.4% of their matches; at the low end, 5.2% projected became 4.8% real. The chances do not change with the Average/Ceiling choice, and players with the L10 badge show no value.
The numbers are lower than many expect: half of all current projections have a P70% below about 12%, and only one in ten is above 23%. A P70% of 30% or more is a strong signal.
If you do not need them, hide P70% and P80% in the display settings of each table.
DS% and xAA: same approach, same inputs
The decisive chance (DS%) and the expected All-Around score (xAA) now come from their own models, built with the same approach and the same inputs as the projection.
DS% is the probability of a positive Decisive Score: a goal, an assist, a clean sheet or any other decisive action. A DS% of 43 means that in about 43 of 100 comparable matches the player has such an action. In the historical tests the new values matched the real frequencies almost exactly, for example 44% projected and 44% real. The previous DS% missed at both ends: high values were too high (57% projected, 33% real) and very low values were too low (0 to 3% projected, 15% real).
xAA estimates the All-Around points of the match. Its average error fell from 9.28 to 8.41 points, and the systematic offset is gone: the previous xAA was about 1.6 points too low on average, the new one is within 0.1.
What a projection is based on
Every projection is built from the player's own data and the matchup:
- The player's own history at the fixed card position, overall and split by competition type and home or away, and at the current club, so that after a transfer it counts how the player performs there
- The player's role: how regularly they have started recently
- The odds for exactly this match: win probability, expected goals for and against, clean-sheet probability, the season possession averages of both teams and, where available, the player's own scorer and assist odds
There are no shortcuts based on league or position. A defender is not projected higher because defenders in that league usually score well; only that defender's own data and the matchup count. One model learns from all players how to read this information, but every single projection uses only the player's own data.
The model is always tested on Gameweeks it has never seen: it learns only from earlier Gameweeks and then projects the following ones, step by step through the history. Projections are recalculated twice a day with the latest odds and when a new Gameweek starts, and they freeze at kickoff.
Badges: how much data is behind a projection
- L10 pill: the player has no own appearances yet, or there are no odds yet and the player has never started. PS shows the Sorare L10 average, or 0 if there is none. The ceiling equals that average, so it is not a real ceiling, and DS% and xAA stay empty. Example: a new signing with an L10 average of 37 shows 37 in both views.
- Red triangle: there are no odds for this match yet. The projection comes from the player's own games and is recalculated once the odds are published. Example: a regular starter projected at 69.9 before the match has been priced.
- Yellow triangle: fewer than five own starts. The model knows the player only briefly, so the projection stays close to typical values. Example: a player with two starts, projected at 47.1.
Projections without odds are useful but less reliable. In a test over 95 Gameweeks, the top five by this projection reached 70+ in 32.2% of cases, compared with 25.6% for the L10 average and 36.8% when the odds were available.
What the historical tests showed
I compared the new model with the previously published Projected Scores on the same matches across 76 historical Gameweeks, looking at the top five players per Gameweek, competition type and card position.
| Top five by | 70+ share | 80+ share | Average score |
|---|---|---|---|
| Average (PS) | 35.2% | 20.3% | 61.7 |
| Ceiling (Q80) | 34.9% | 20.2% | 61.3 |
| Previous PS | 22.7% | 10.7% | 54.0 |
Sorted by the Average, the top five reached 70+ 12.5 percentage points more often than with the previous PS (95% interval: 10.4 to 14.6) and 80+ 9.6 points more often (7.9 to 11.4).
The August update was a small adjustment on top of the old model; the new model was built from scratch, and its advantage in testing is several times larger.
Average and Ceiling pick the top five almost equally well, within about half a percentage point. They differ in what the number means, not in how well they rank players.
The Average also holds at the top: in the same Gameweeks, starters projected between 70 and 80 scored 73.0 on average. Previous projections in the same band came in at 56.6.
The Ceiling behaves as defined: 20.45% of the scores were above the projected Q80, against a target of 20%.
Limitations
- Football stays football. A strong projection does not protect against an early substitution, a red card or a missed chance.
- All values assume that the player starts and plays at least 45 minutes. Always check the starting probability, the expected minutes and injury information as well.
- The odds are only as good as the market at the time of the calculation. The historical tests used the final odds; live projections use the latest odds available, so live results can come out slightly lower.
- Matches without odds are projected from the player's own games and are less reliable.
- Scores of 80 or 90+ remain rare and therefore hard to predict.
- Every projection is now kept as it was at kickoff. I will follow the live results over the coming Gameweeks and report them in a follow-up post.
How to use Average and Ceiling
- Average fits targets you want to reach reliably: thresholds, smaller competitions and lineup spots you want to fill safely.
- Ceiling fits large competitions where only top scores count, the search for 70+ candidates, and decisions between several likely starters with similar averages.
- P70% and P80% help when you need one big score from a single pick, for example a captain.
- DS% helps with decisive tasks and with players whose value depends on goals and assists.
If you mainly build for leaderboards, the ceiling view shows the upside directly. If you want a realistic expectation, stay with the average.
Conclusion
The ceiling uplift was the first step towards upside-focused projections. The new model goes further: built from scratch, calibrated, and with a clear separation between what a player will probably score and what is possible. You decide which of the two SoProb shows.